The second of the Charting Basics series, in this article we’ll be going over simple and exponential moving averages, and how to use them to determine trends.
Moving Averages
A moving average is a lagging indicator used to define the trend of the price. Seems like a lot of information to digest at once, but let’s break it down. First, an indicator is another way to visualize the data on a chart. Furthermore, a lagging indicator is just a fancy way of saying it cannot be used to determine the future movement, but confirms the past movement or trend.
For lagging indicators, there are two different kinds of moving averages that are commonly used: a simple moving average and an exponential moving average. Both will be indicated by the appropriate abbreviation, and then a number indicating the amount of periods used to determine the value. For example, a 12 period simple moving average would be represented as SMA12.
Simple Moving Average (SMA)
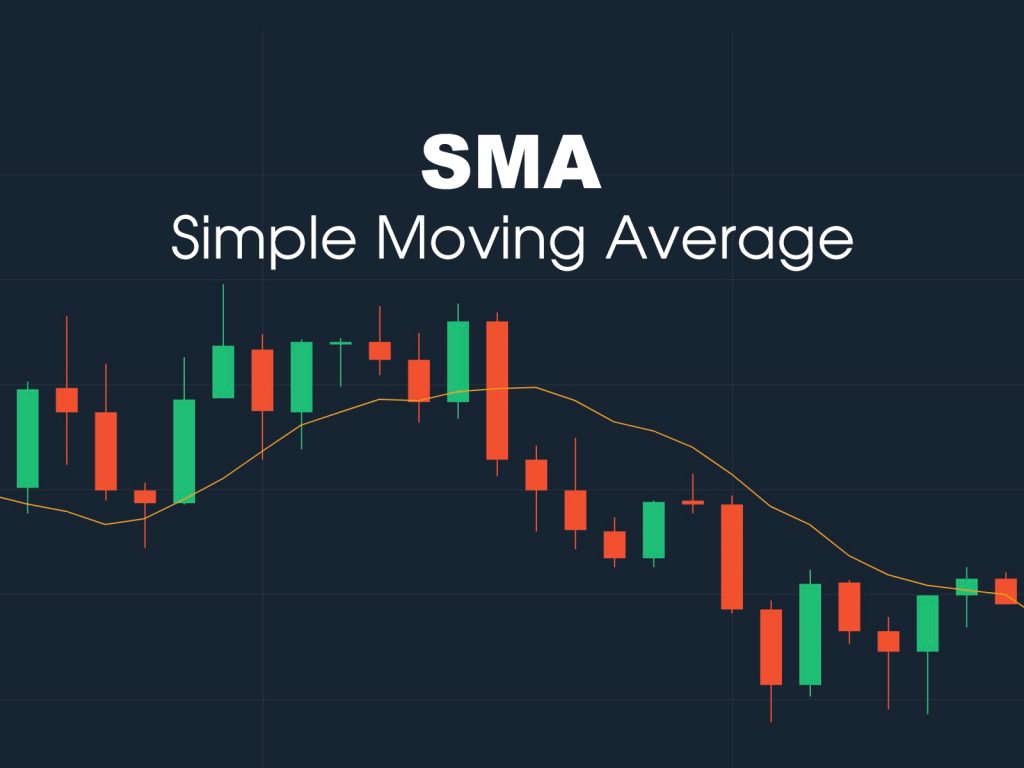
A simple moving is just as it states, a simple average of the data visualized as a line on the chart. Using our previous example of the SMA12, it would take the previous 12 periods to determine the point on the chart for the current period. The SMA is then plotted on the chart and the trendline is established. See the below image for an example of an SMA.
Exponential Moving Averages (EMA)
An exponential moving average is very similar to the simple moving average, but the difference is it gives more weight to the current value. With the current value being weighted, this makes the calculation more responsive to an immediate change. For visual purposes, it looks identical to the simple moving average.
Although the EMA is still a lagging indicator, it can be more effectively applied to a trend’s current value. I tend to prefer the exponential moving average over the simple moving average for this very reason.
Charting Basics: Candlesticks and Periods
Charting Basics: Moving Averages
Charting Basics: Putting it Together
Charting Basics: Optional Indicators
Shameless plug, if you find this helpful and plan on opening a TradingView account or Tastyworks account, please use my referral links.
TradingView
https://www.tradingview.com/gopro/?share_your_love=bcmiller08
tastyworks
https://start.tastyworks.com/#/login?referralCode=GA3Q7TNZBC